Off Grid Bazaar

From pump monitoring to a lightweight project management and monitoring platform

My Role
Lead Product Designer
Duration
3 months, from initial requirement gathering to deployment
Focus
Product Definition · Requirements · Information Architecture · Data Visualization · Stakeholder Alignment · QA
  • 300+

    systems accommodated after deployment

  • Searchable

    project records that replaced paper-based lookup

  • Real-time

    pump visibility, replacing phone calls for monitoring

Monitor the agency’s pumps

The starting point was simple: use Gham Power’s IoT technology to monitor pumps.

Gham Power already had an IoT system for monitoring solar-powered water pumps, and it could collect a large amount of sensor data per installation. A government agency wanted to use it for pumps installed through its own projects.
Monitoring needs context

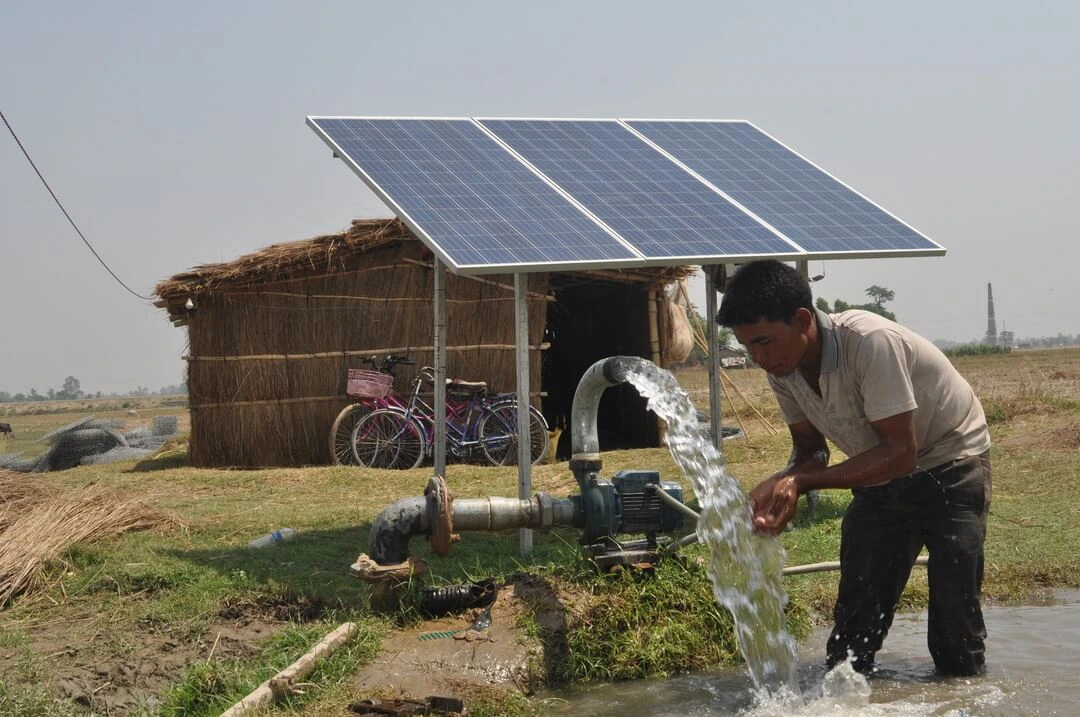
A farmer beside a solar-powered water pump in a field

To monitor a pump, you need to know what it is, where it is and how the project was documented.

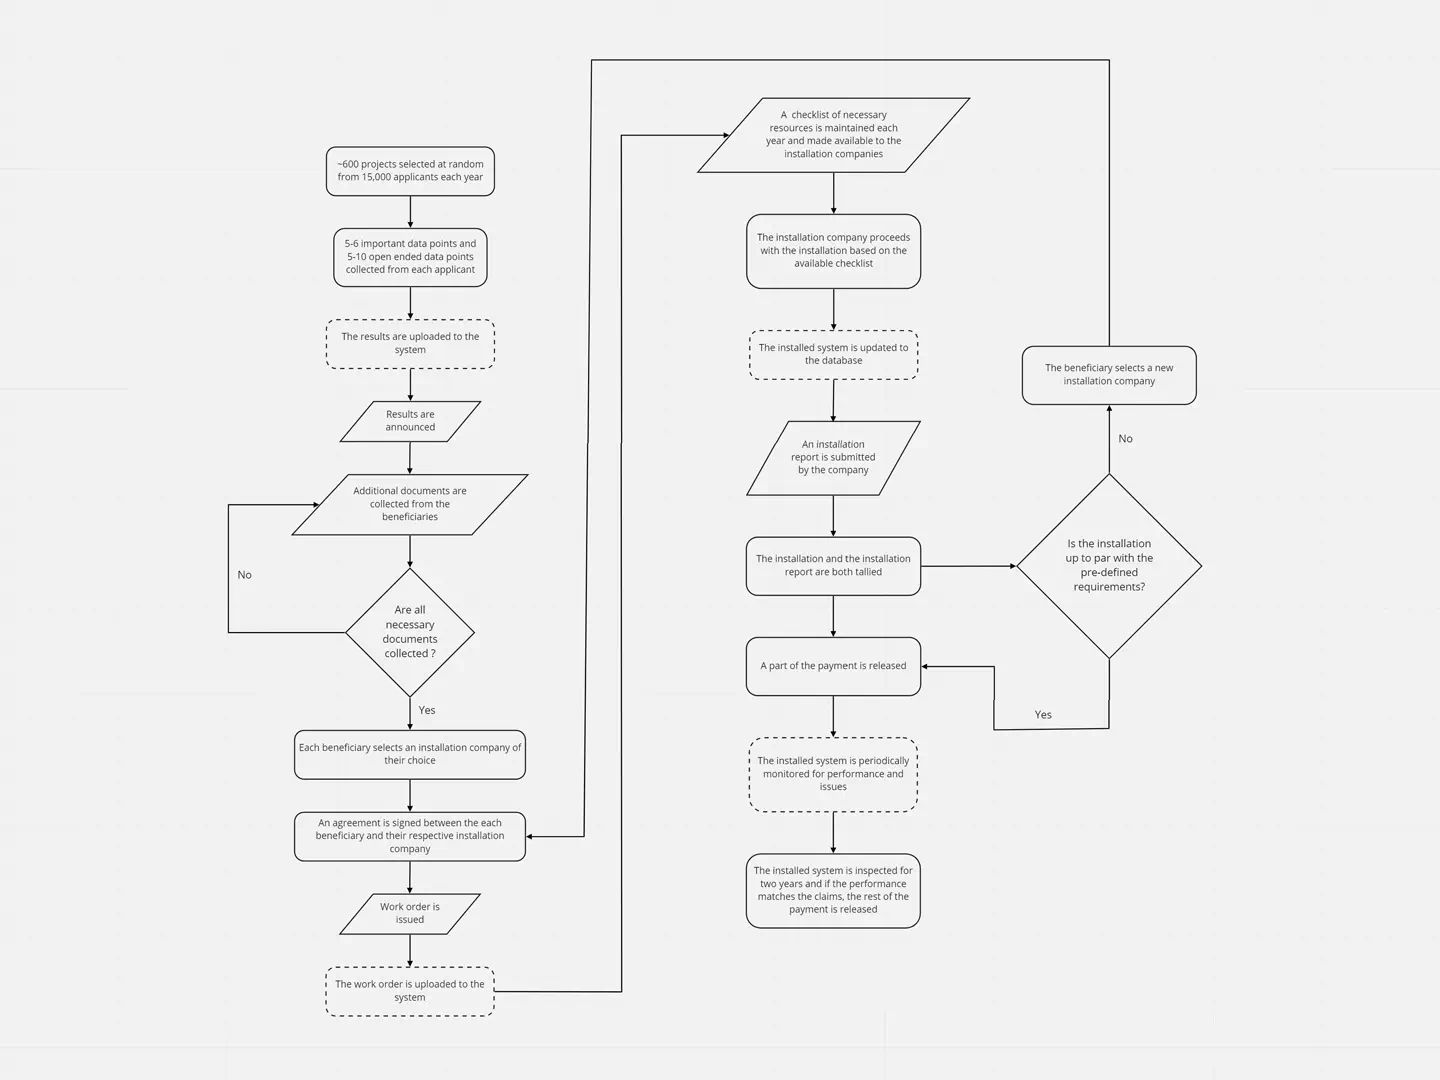
The agency had thousands of project records and extensive technical documentation, but no single place to connect them to live data. Specifications weren’t always consistently documented, which raised a chain of questions. How do we document them digitally, what else could we do with that information, and how much of it belongs in this product?

A few weeks were spent talking to the representatives in the agency.

Two needs, one boundary

Both sides had legitimate needs. My job was to find the boundary between them.

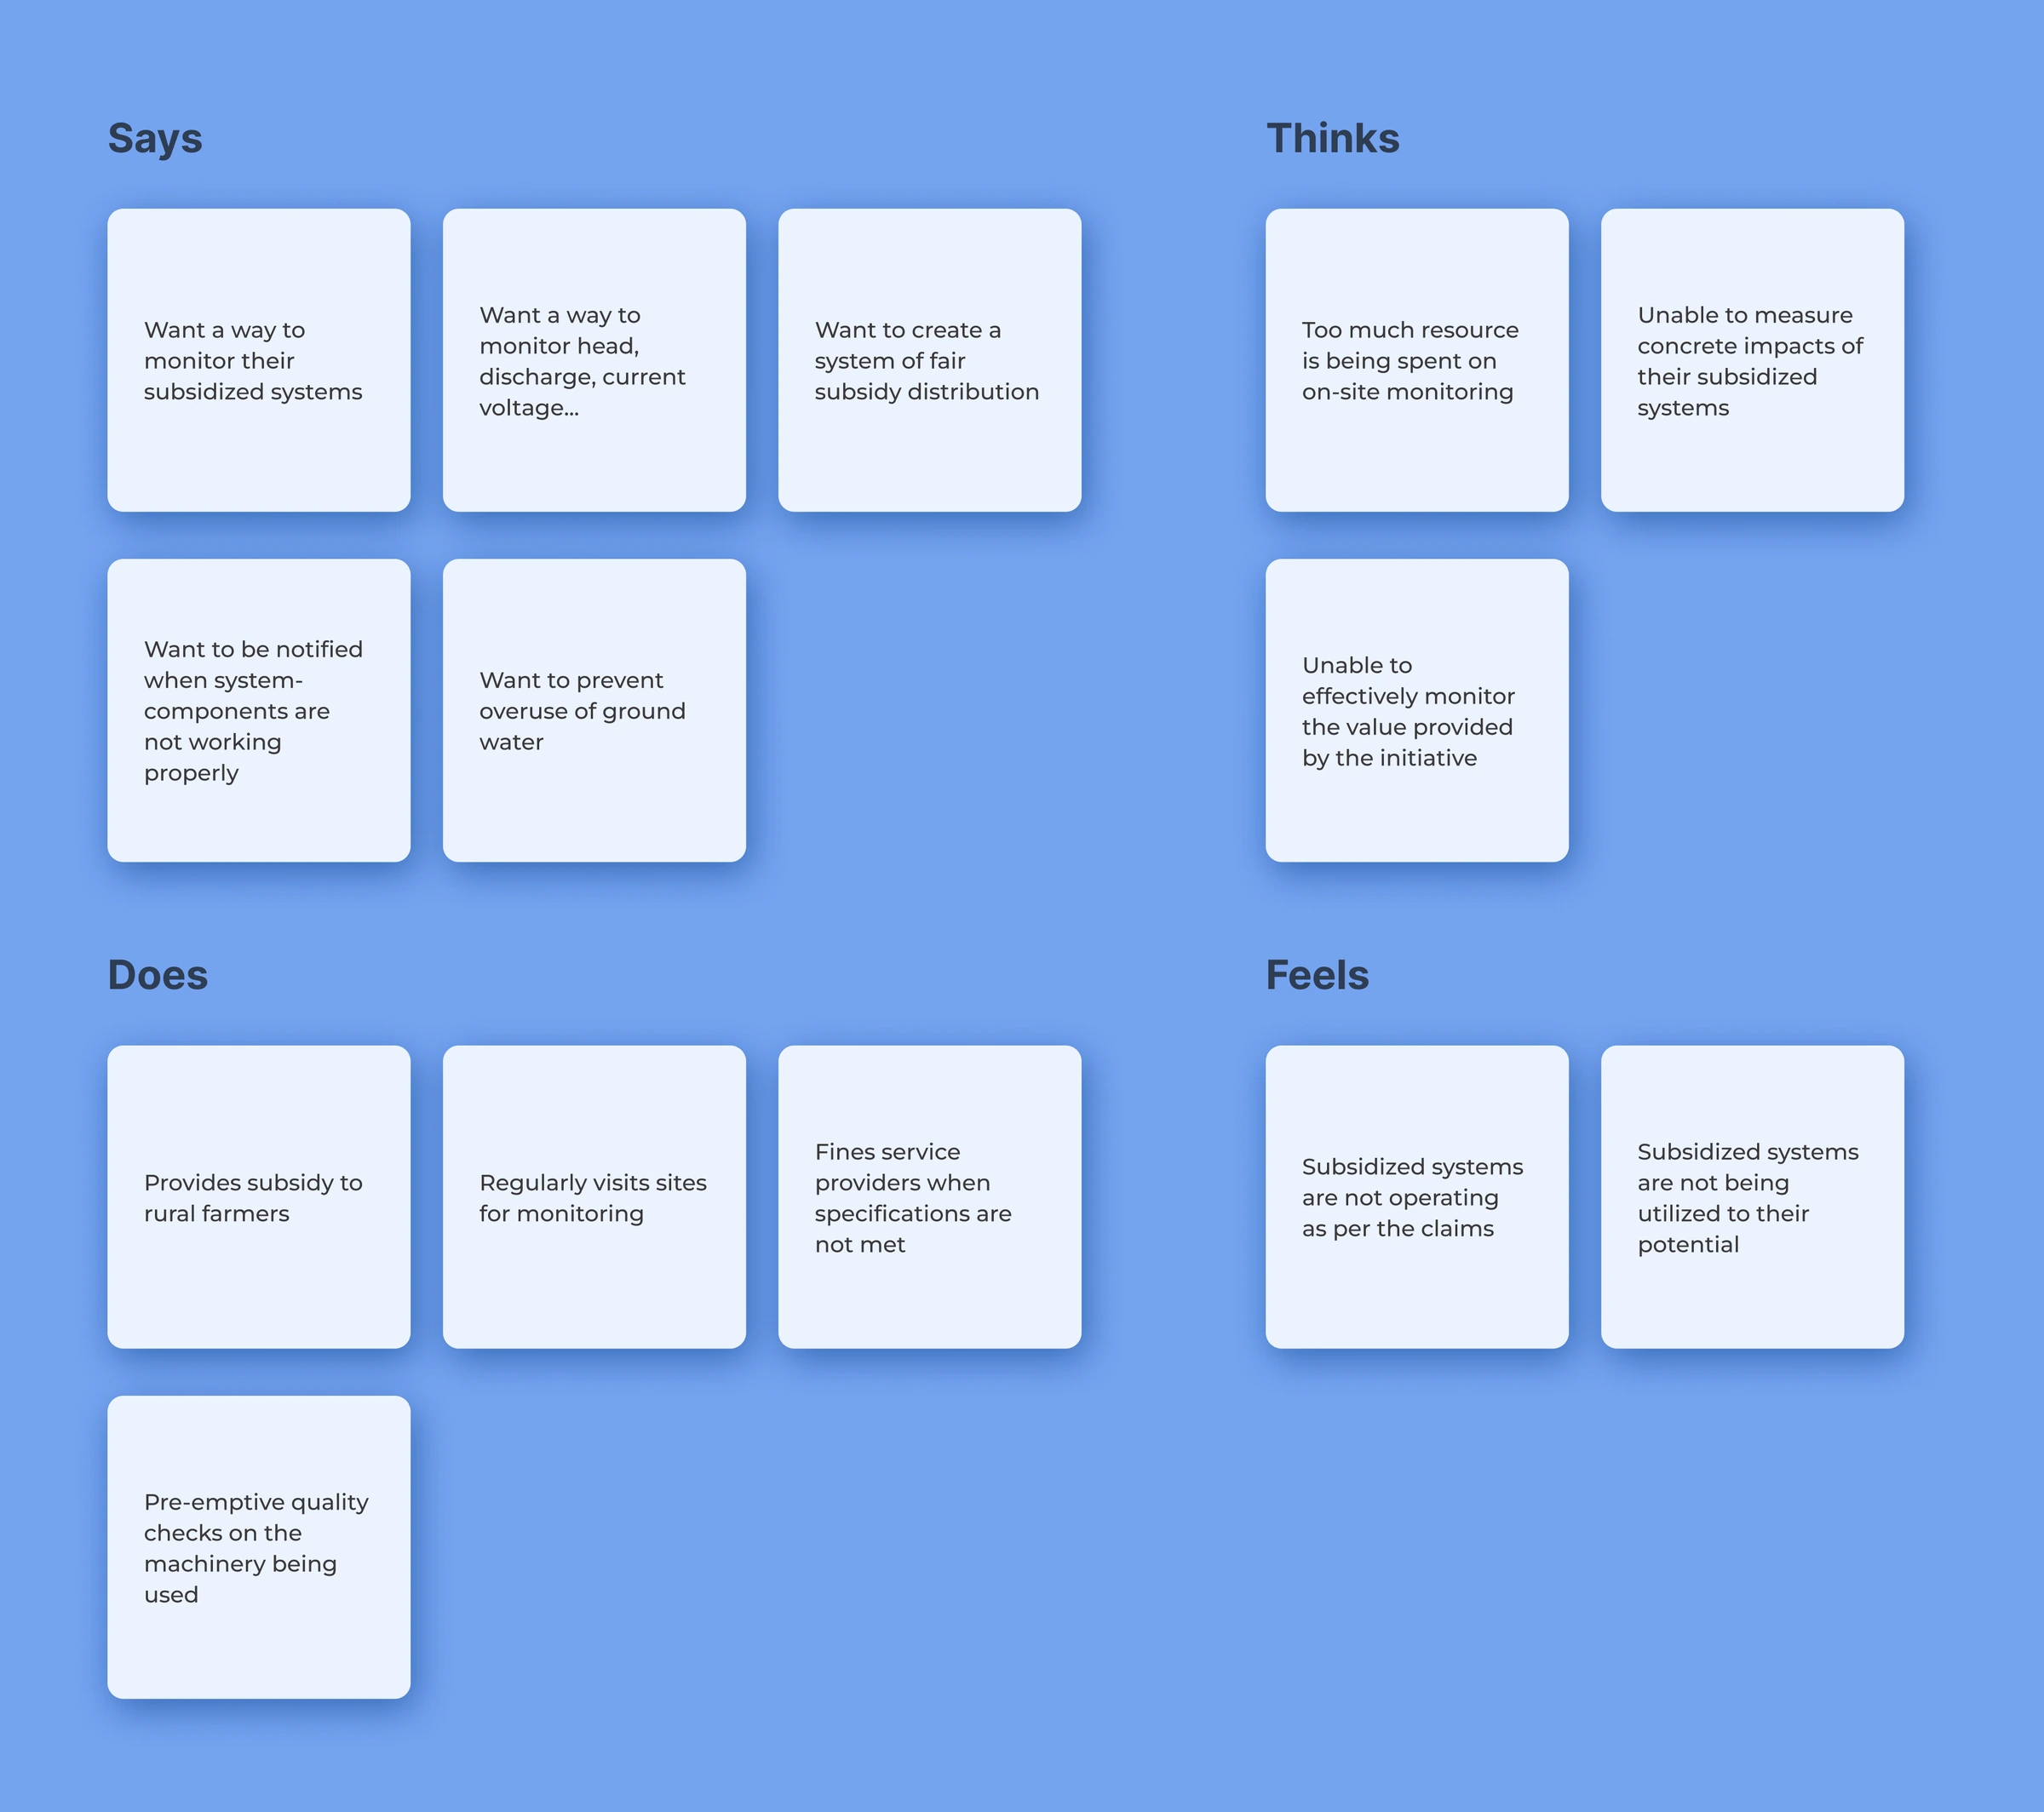
Gham Power needed a focused product that built on its IoT capability and could be delivered efficiently. The agency wanted to improve how projects were documented, monitored and managed. As requests for analytics, knowledge generation and reporting grew, I separated must-haves from good-to-haves and looked for the smallest extra scope that would make the first version genuinely useful. Having an empathy map on hand helped me negotiate on behalf of the users during in-house decision making.

Lightweight, not feature capped

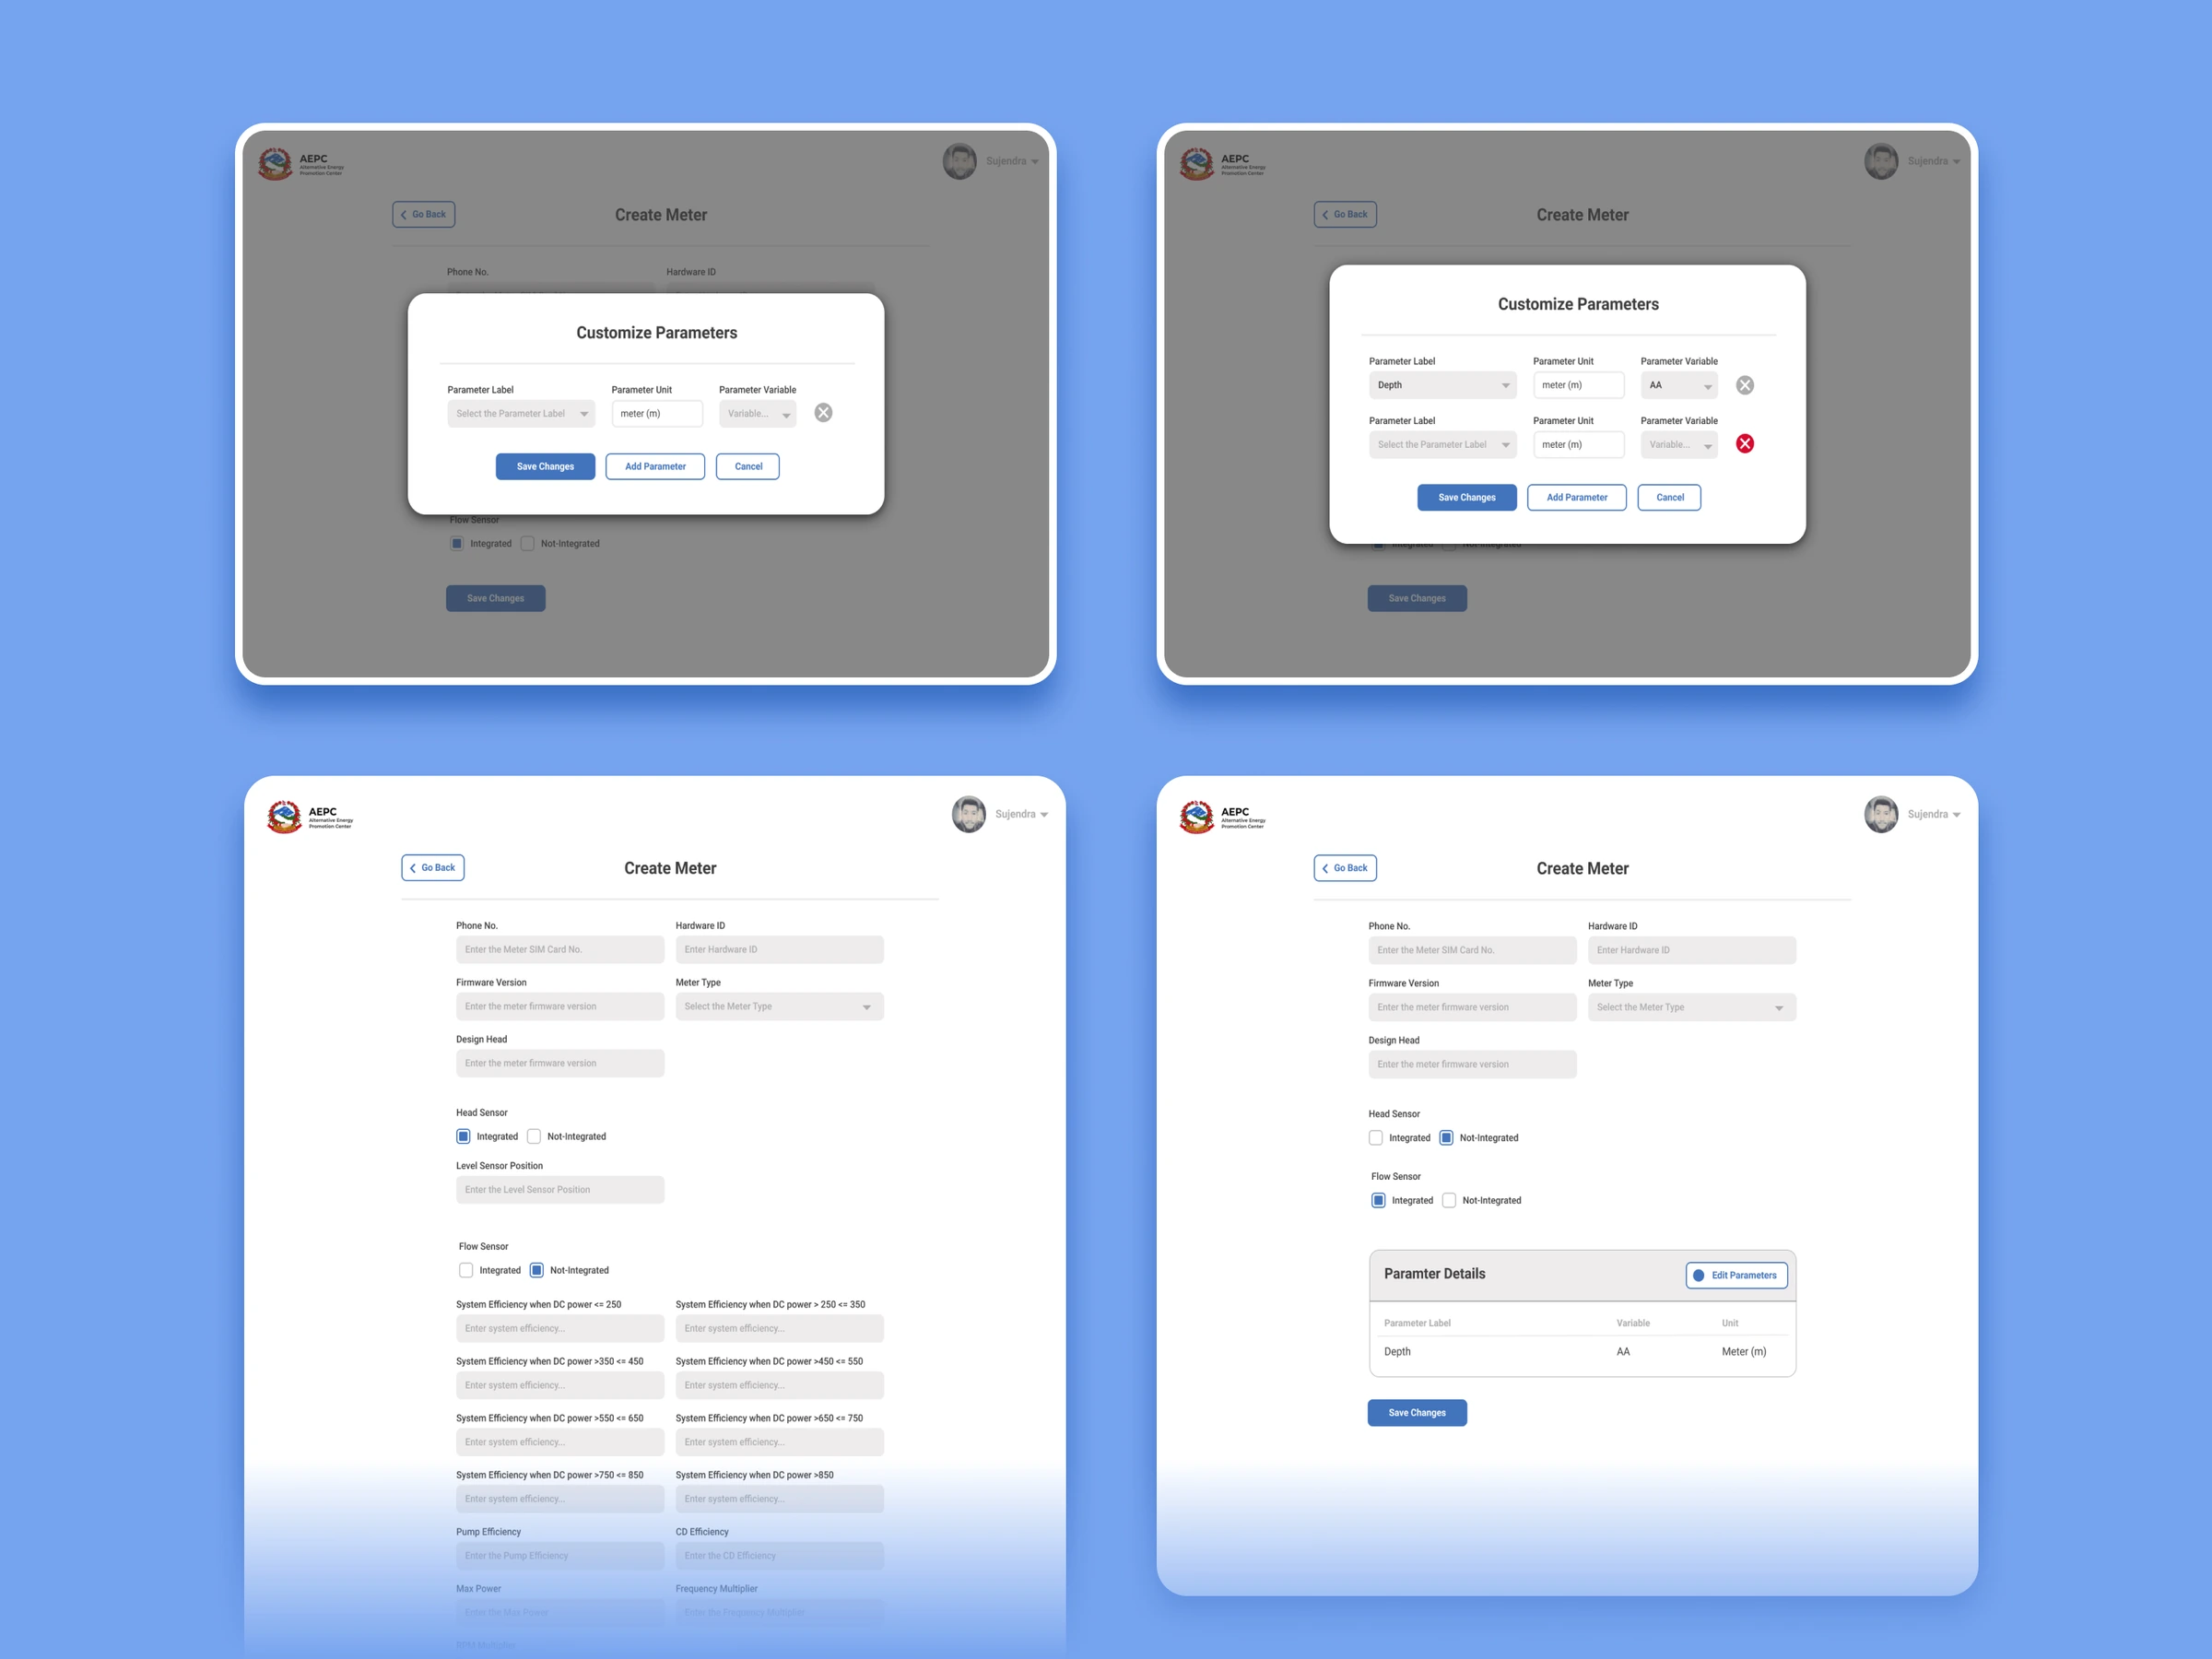
Screens for customizing the device parameters

The answer was a platform, not a standalone dashboard.

The first release covered project documentation, live monitoring connected to each project record, and search and reference in place of fragmented paper records. Advanced analytics, project-specific notifications, knowledge generation and report generation were good-to-haves, not need-to-haves, so they were deliberately left for later.

Their forms, made digital

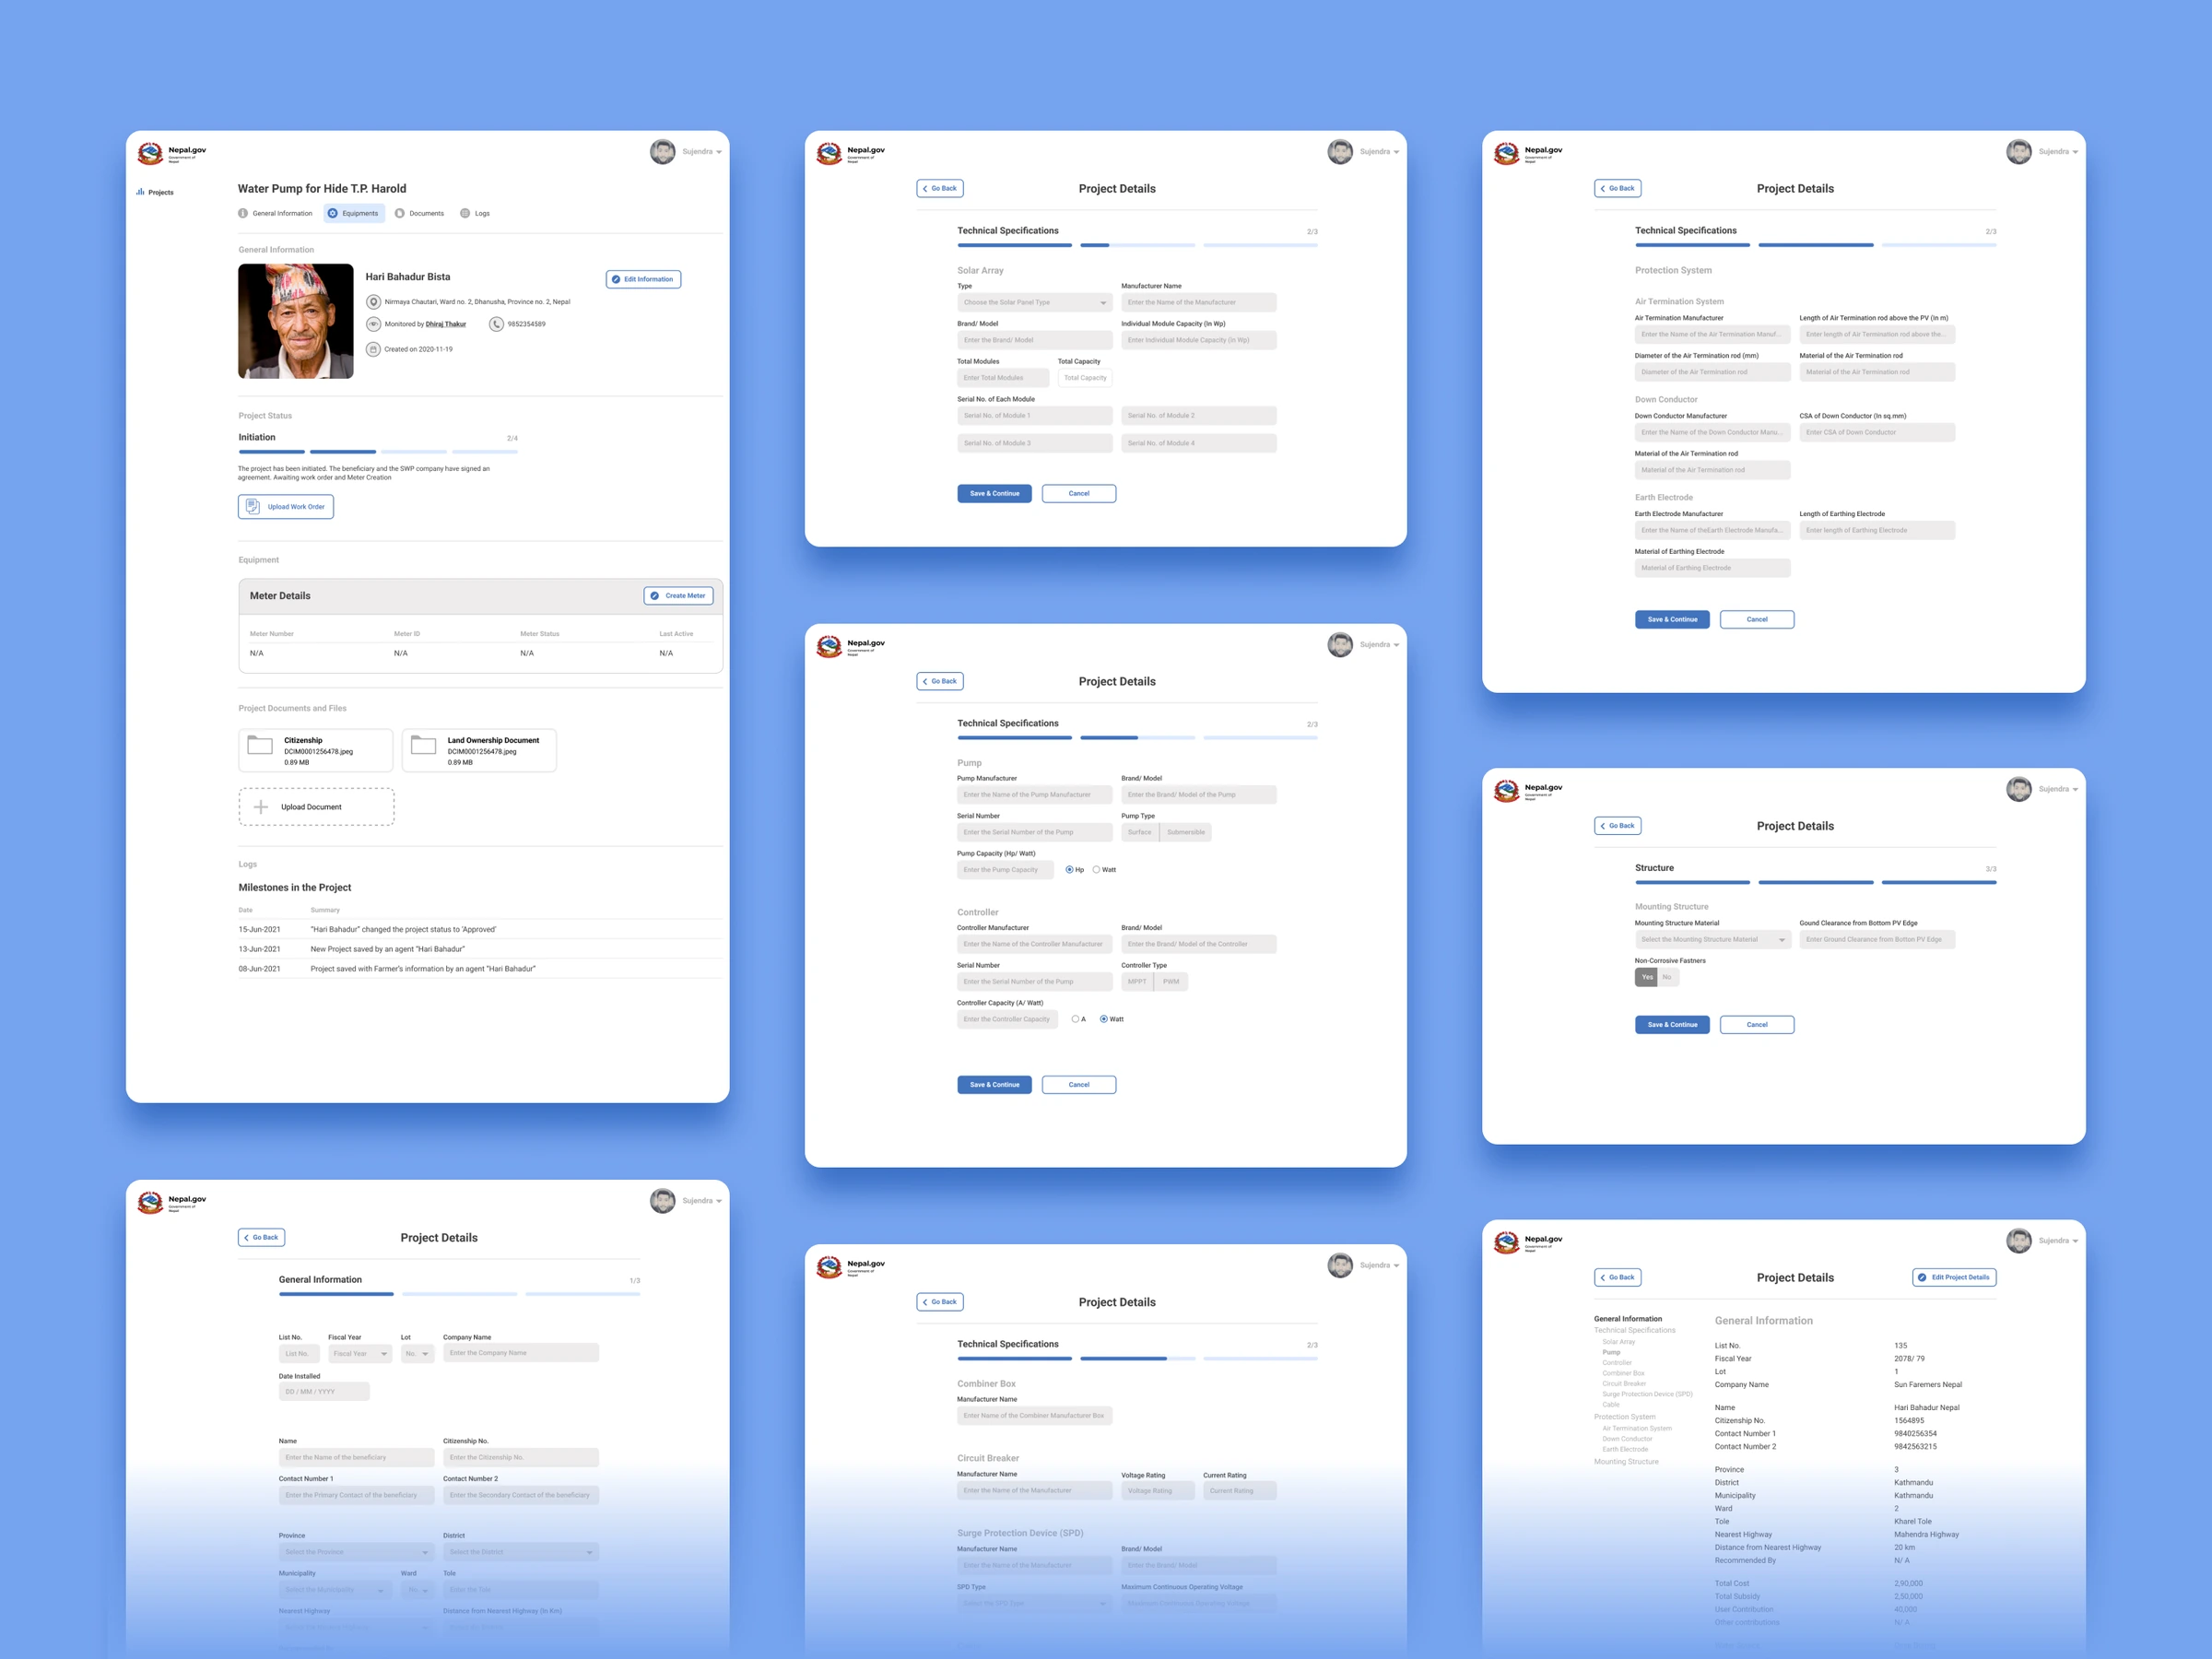
The multi-step project creation forms

I kept the agency’s own structure and made it usable on screen.

Rather than force a new mental model, I preserved it. A spreadsheet can hold a lot in one view, but a screen can’t, so the forms were:

  • Chunked into meaningful sections
  • Resumable, since digitizing historical projects couldn’t happen in one sitting
  • Keyboard-friendly, for people used to spreadsheets
  • Familiar, using existing terminology wherever possible

I spent days going through their forms and spreadsheets to learn their terminology, groupings and the information they needed to record.

A regular dashboard wouldn’t suffice

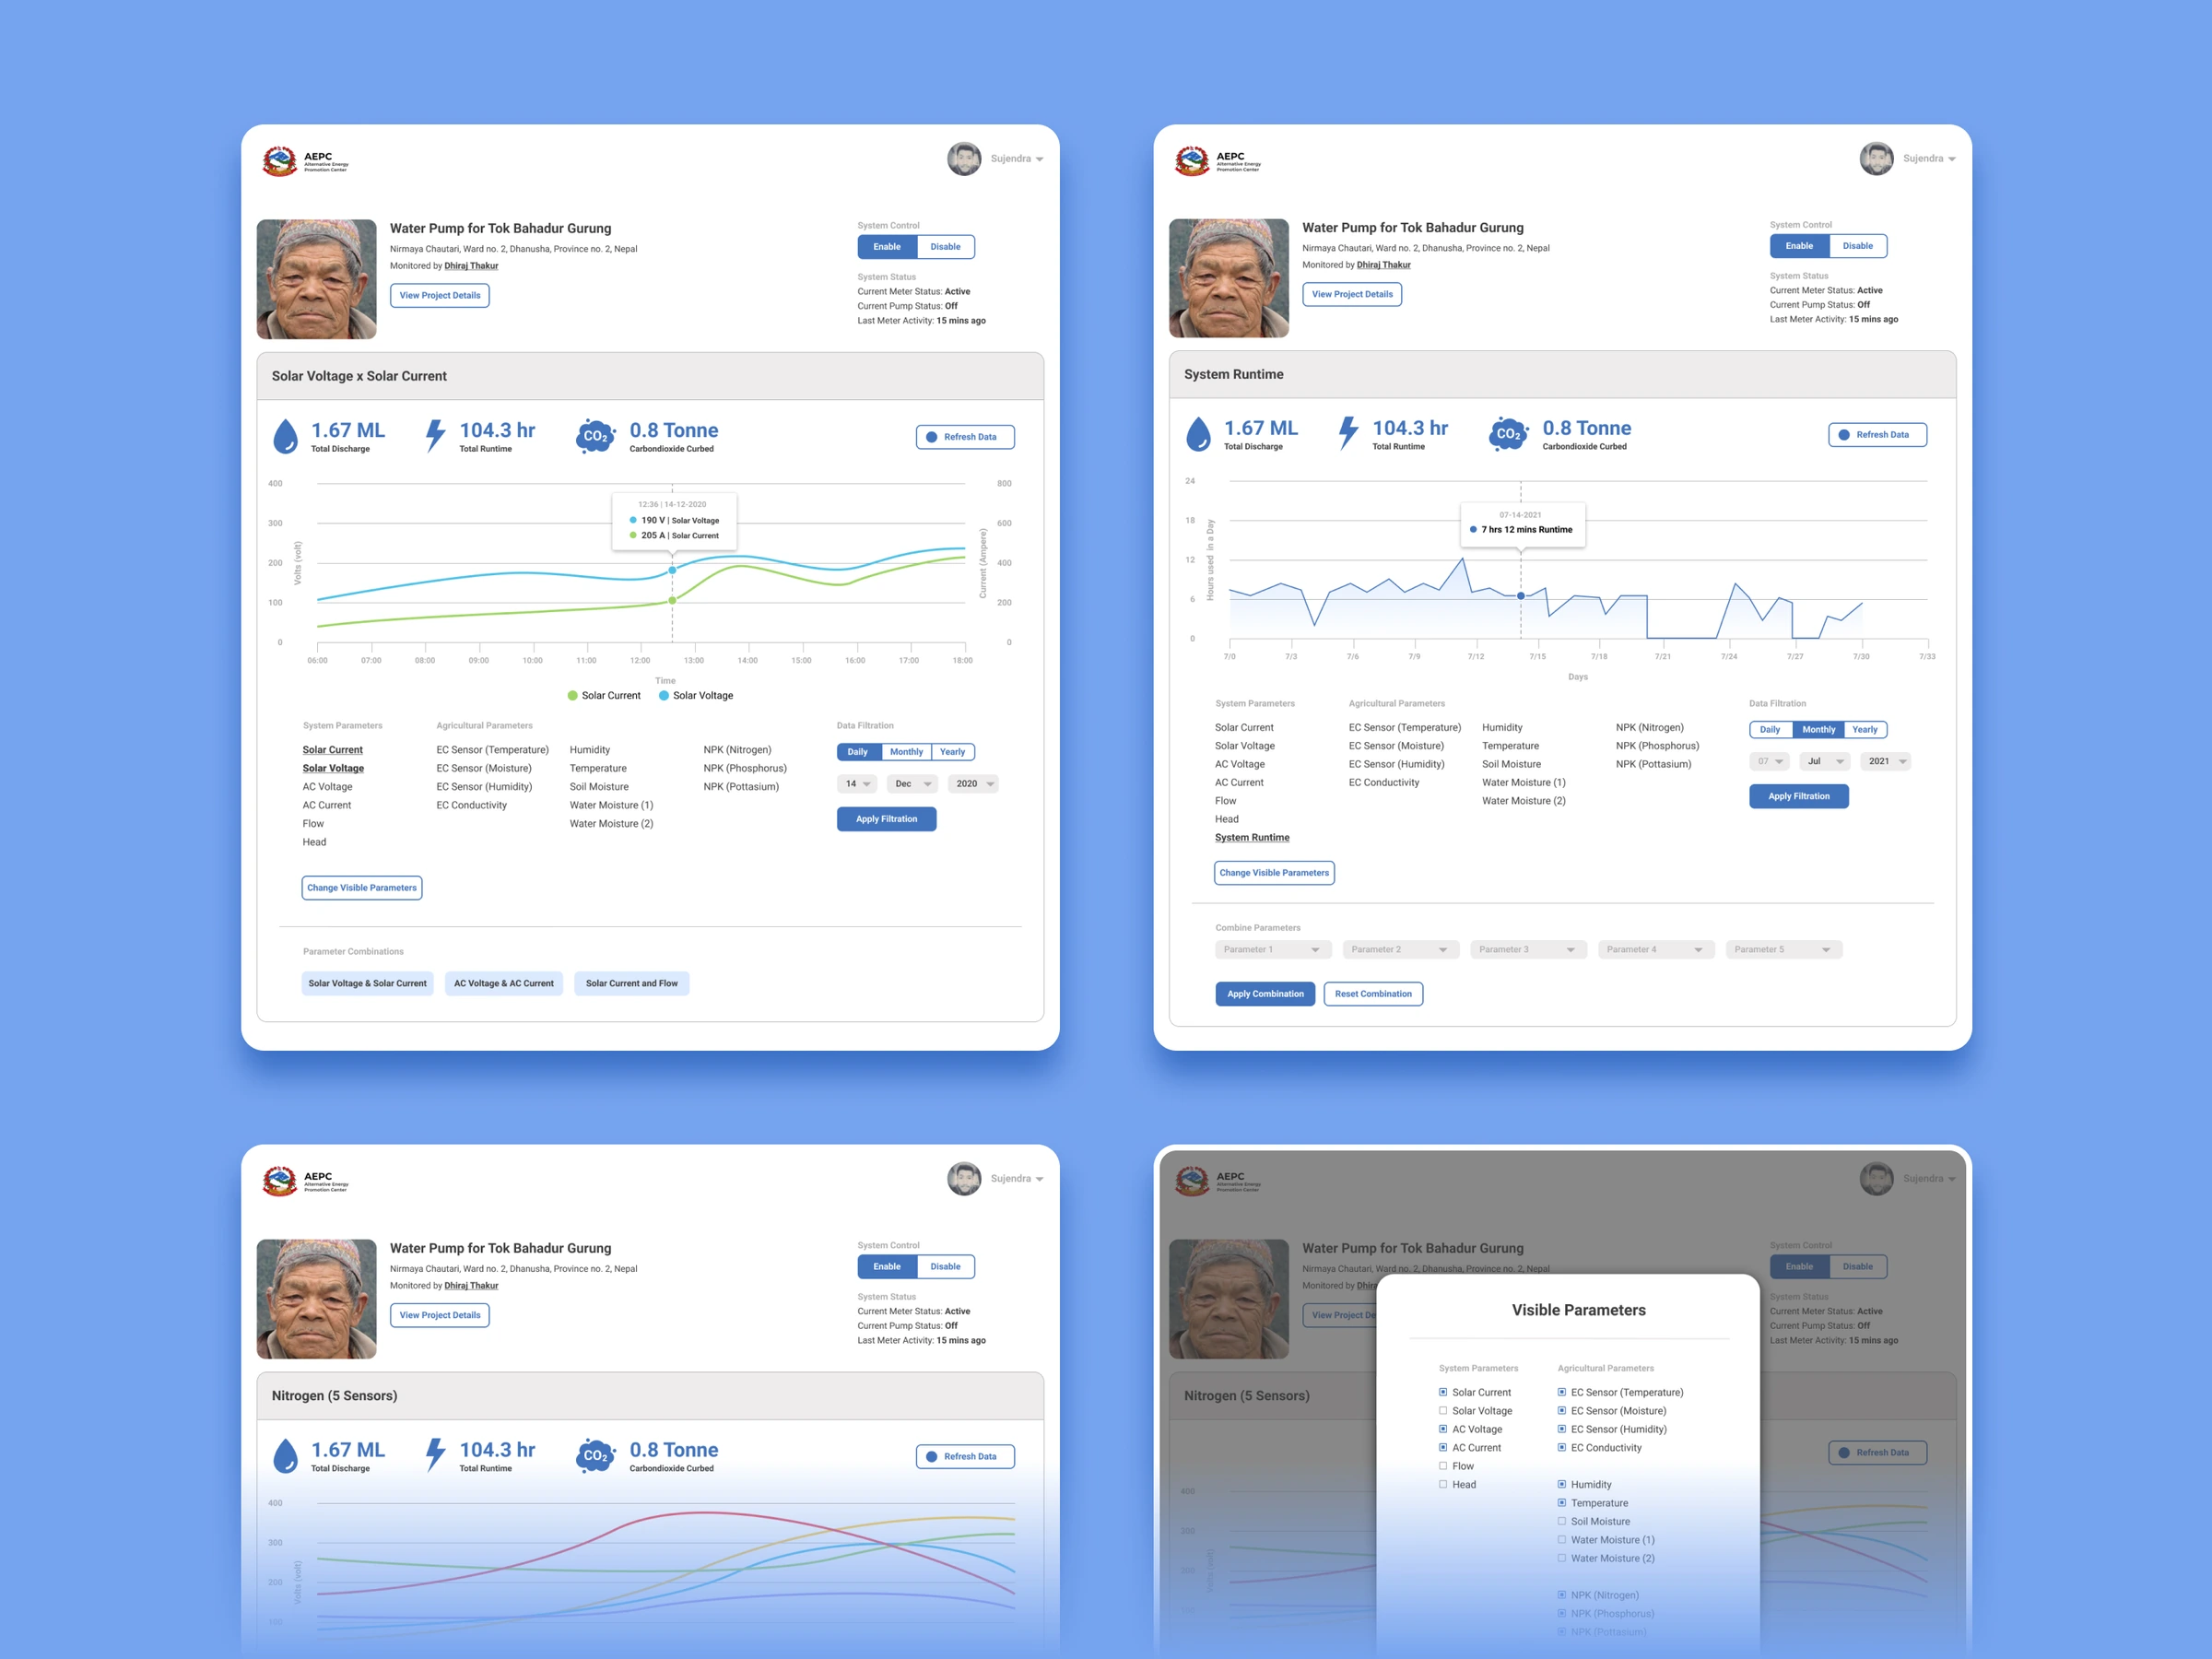
Sensor charts with controls for the time period and parameters

Users decide what data matters for the task at hand.

The IoT system produced far more data than anyone needed to see at once, and a fixed dashboard would have guessed which measurements mattered to whom. Prototype validation confirmed it. Users wanted control over which sensors to show, the time period, and how measurements could be viewed together. So the data stayed comprehensive and the interface became flexible.

Built lean

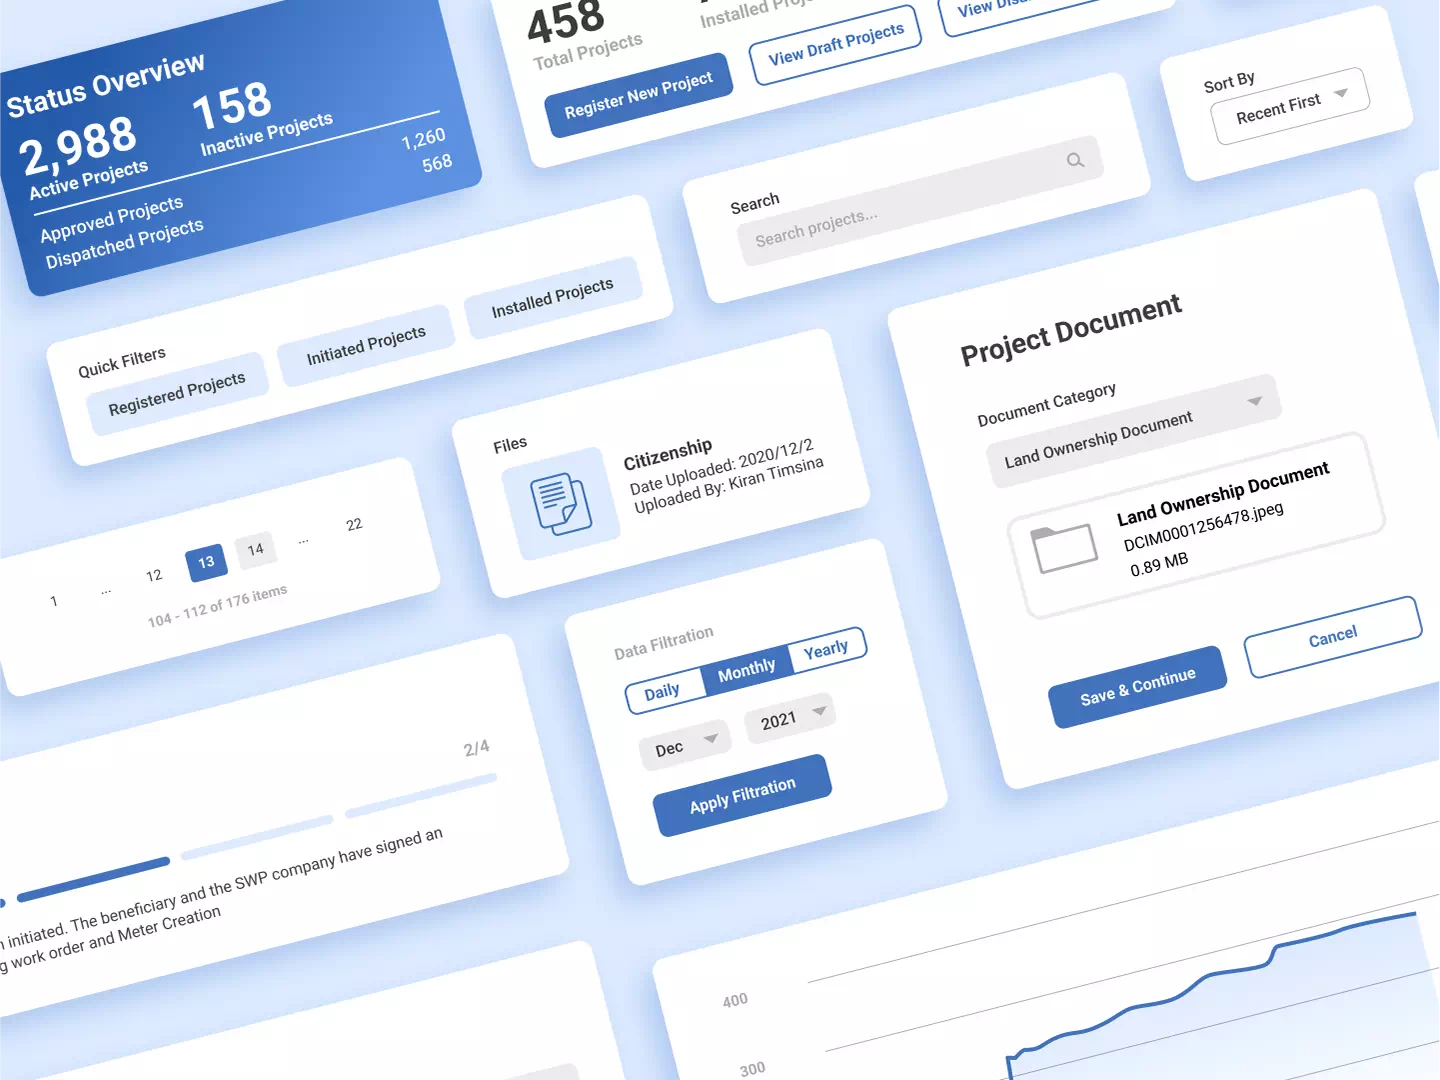
Cards, filters and form elements from the platform

Design effort went where it mattered, not into rebuilding a component library.

The product had to stay light to develop for cost reasons, so I repurposed an existing design system, keeping its layouts and components and adapting the visual tokens. That freed time for information architecture, workflows, interaction and data visualization.

Documentation meets live data

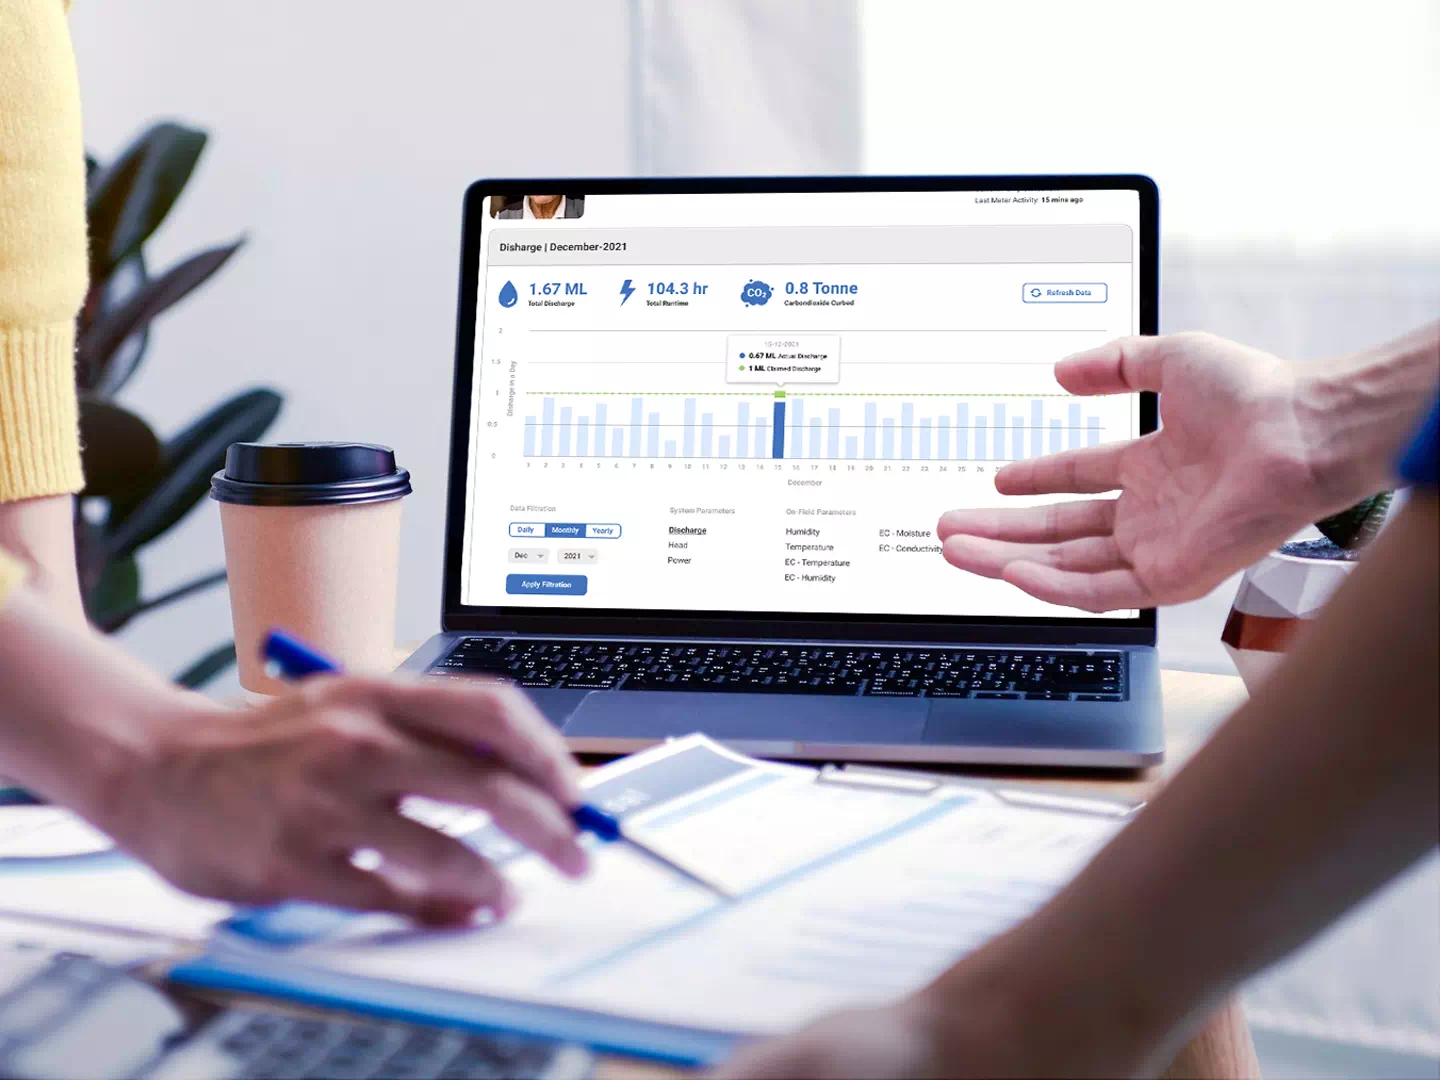
Live pump data on a laptop during a meeting

One product now holds both what a pump is and how it’s doing.

Before, checking whether a pump worked could mean calling the farmer and relying on their account, or travelling to each pump, which cost man-hours and money. Both made it hard to know if an installation was running as expected. Now each project record sits beside a direct signal from the pump itself.

300+ systems, live

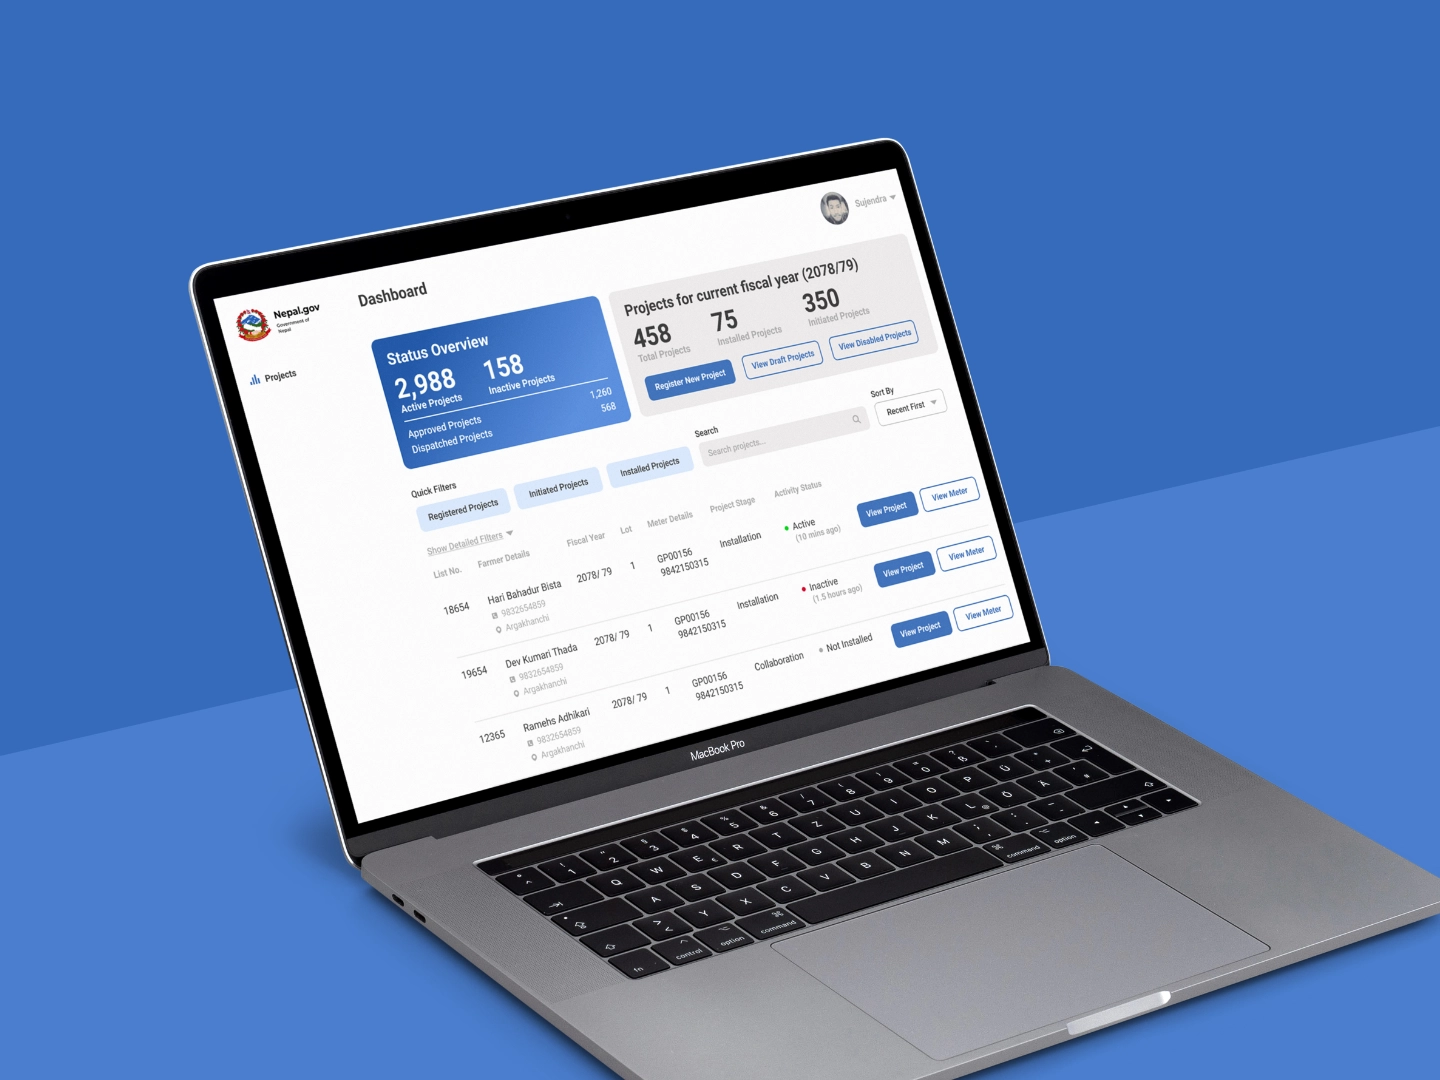
The operations dashboard on a monitor in a meeting room

The agency got a searchable record, direct pump visibility and room to grow.

More than 300 systems were registered after deployment. Project information became searchable instead of depending on physical documents, and the platform now gives analytics and reporting a foundation to grow from. The agency’s feedback suggested that searchable digital records will save significant manual effort, though this wasn’t formally measured.

Involve them earlier

I would bring the agency into the product direction before the first prototype.

Requirements emerged through unstructured interviews, existing documents and prototype validation, which worked. But some scope and information-architecture discussions came late. Reviewing the direction earlier would have let both sides agree sooner on what the product is, what it isn’t, and what belongs in the first release.